Dashboard and reporting
Want to know more about reporting in Energinet?
Dashboard and reporting
Use the powerful reporting tools in Energinet to compare, analyze, and understand the performance of your buildings. With our EMS, you can easily share reports and insights with your tenants and colleagues, enabling you to make well-informed decisions and improve the overall energy efficiency of your buildings.

Create custom reports that provide users with relevant data
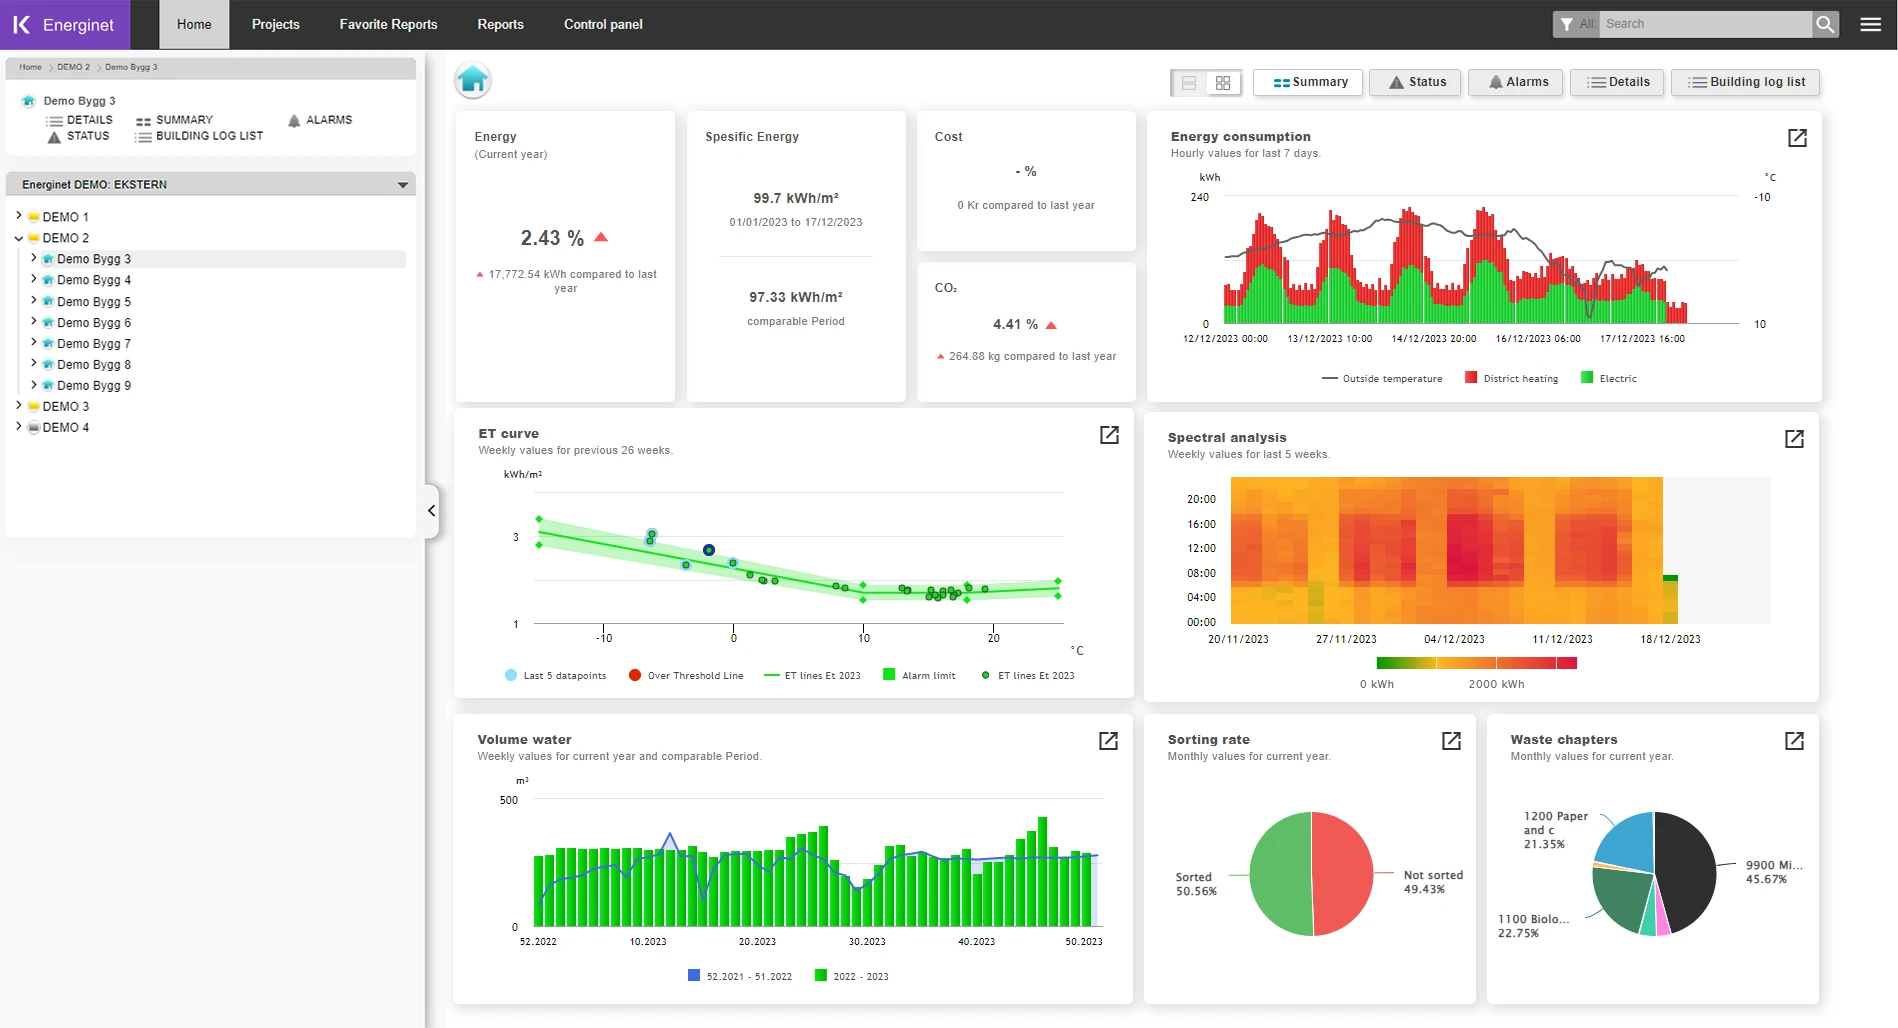
One of the main features of Energinet is the ability to create custom reports that provide users with relevant data. These reports can compile any type of data, such as energy, water, waste, cost, and CO2 savings on an individual building or folder level. By analyzing this data, you can gain valuable insights into your buildings' energy performance and identify improvement areas. The analysis will help you make well-founded and timely decisions, ultimately leading to cost savings and a more sustainable future.
Report types
Choose from standard reports
Select from a wide range of pre-made reports that are readily available. These reports contain comprehensive information on your building data, CO2 emissions, and associated costs. You can compare the overall reports for a group of buildings or the entire portfolio, or you can choose to analyze individual buildings or specific sections of a building.
Examples of reports ready for you to use:
- Energy analysis,
- Spectral analysis,
- Carbon dioxide emissions,
- Energy signature,
- Energy consumption,
- Water usage,
- Waste quantities,
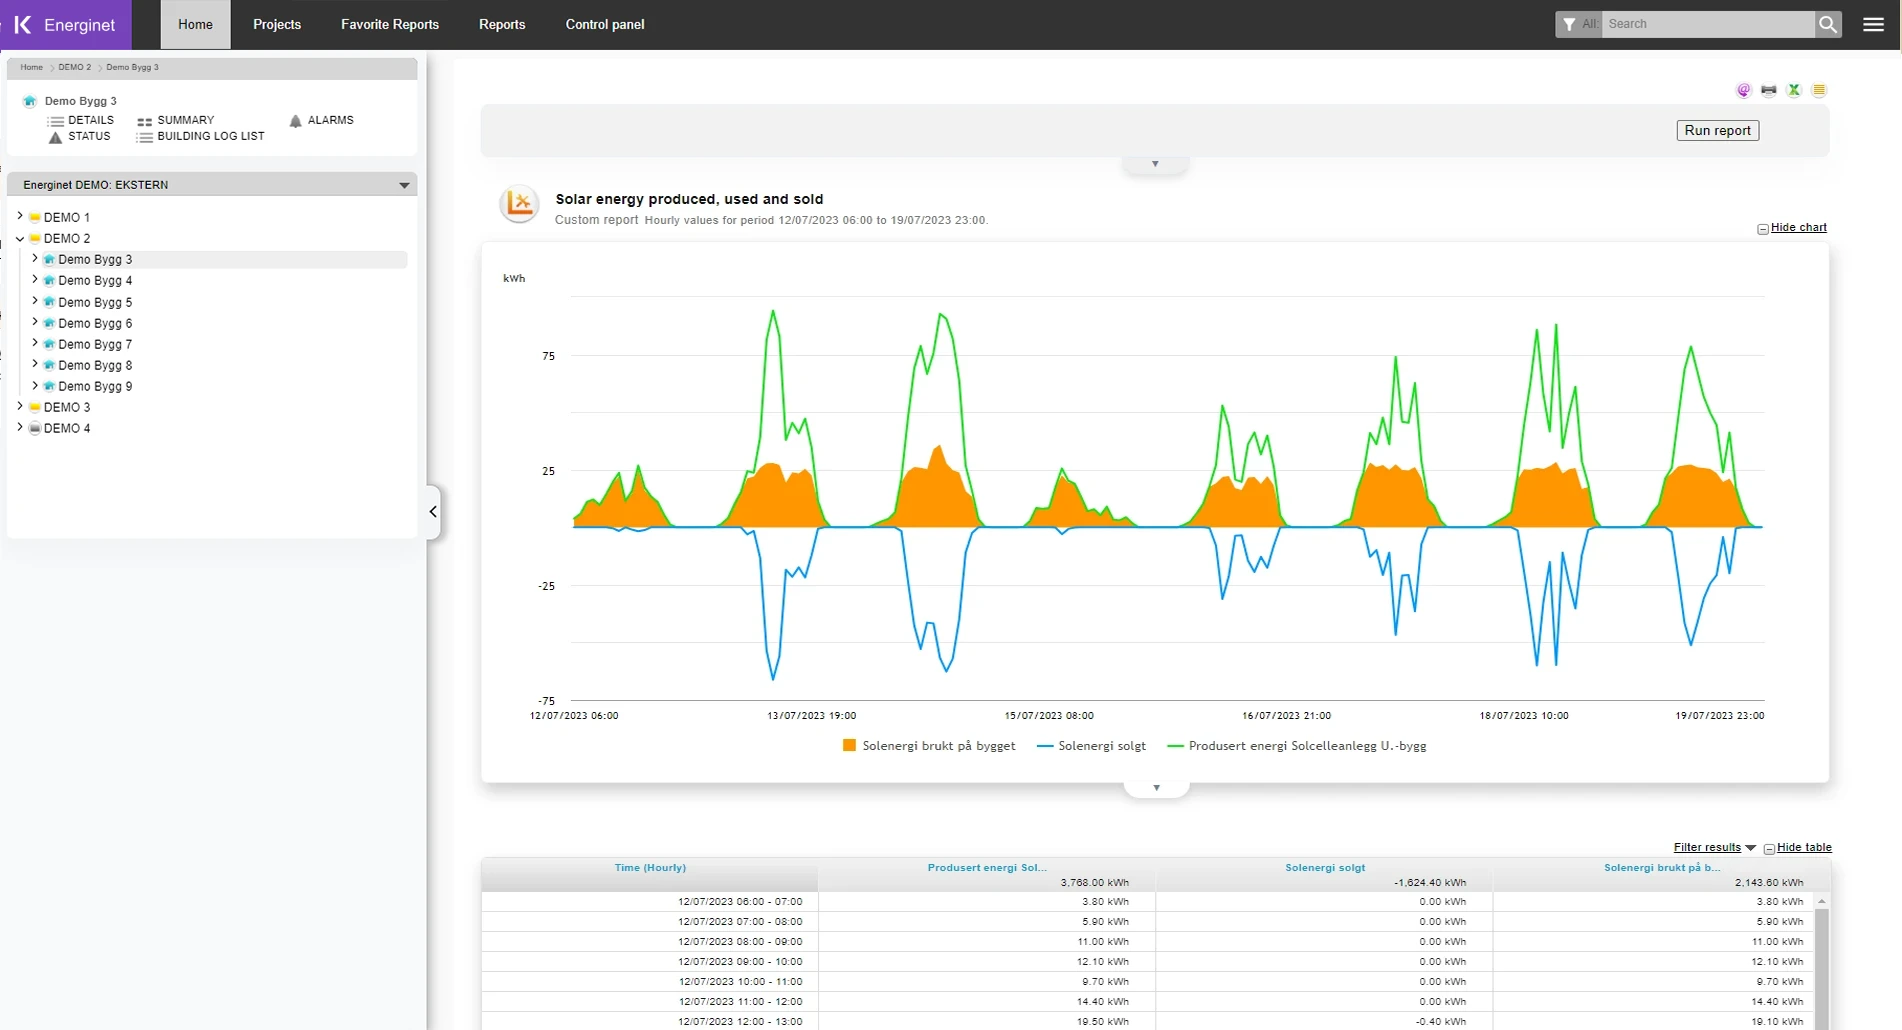
- Solar production,
- COP figures,
- Building performance comparisons
Custom reports
Unleash your creativity by building custom reports that cater to your unique requirements. Whether you need to create a tenant report or perform an energy analysis, you can do it however you want. With customized reports, you can also use your custom meter types and virtual meters (smart meters) to get the necessary data.
Dashboards
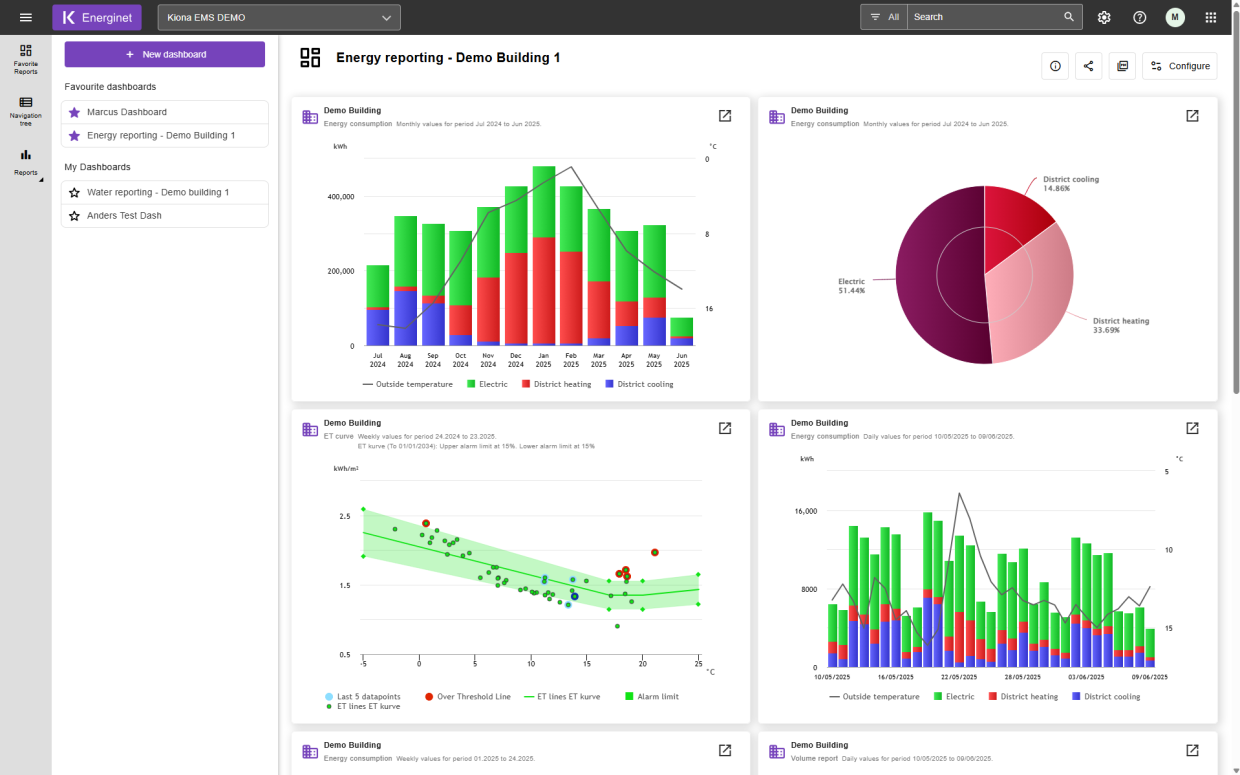
Dashboards with favorite reports
Create your dashboards by selecting standard reports or creating your custom-made reports. With Energinet Dashboards, you can create multiple private and shared dashboards, empowering you with customization and flexibility and letting you control data more effectively. You can share all reports and dashboards so they are accessed by other roles requiring quick business insights without extensive setup or customization. All dashboards can be marked as favourites for fast and convenient access. Users can view and export them for further analysis or reporting purposes.
Automation
Automatic reporting by e-mail
You can use standard or custom-made reports to distribute data effectively to colleagues, tenants, or customers. Energinet offers the option to send reports automatically via e-mail at pre-determined intervals.
- Send reports on a yearly, monthly, weekly, or daily basis.
- You have complete control over when to send the reports, for example, on the fifth day of every month or every Monday.
- Choose what you include in the different reports, such as graphs, tables or data in CSV formats.