

We are continually working to improve our Platform, and this time our focus has been on the Operation Center in IWMAC. Based on user feedback, this update simplifies the work in the Alarm view and gives the Plant view greater flexibility and an overview.
Operation Center updates – Mobile only
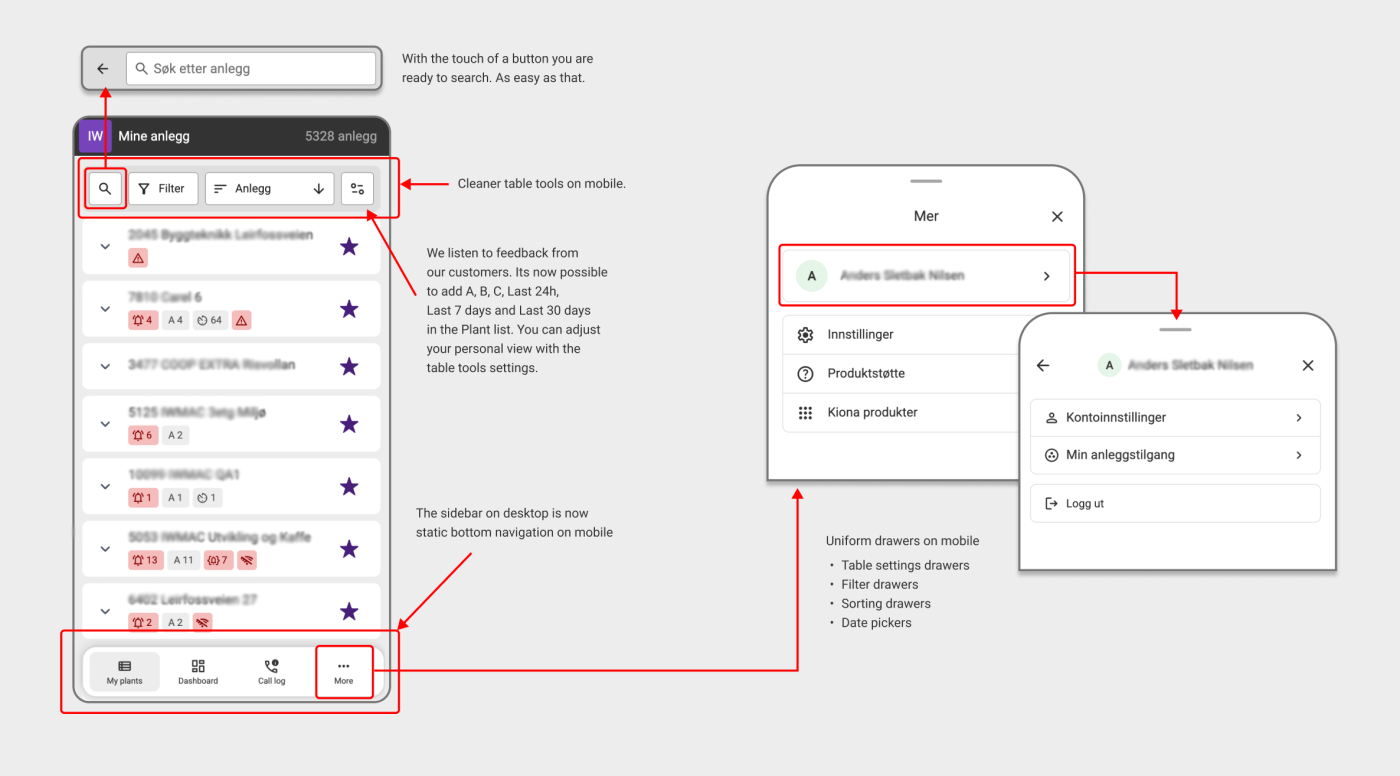
Bottom navigation
A fixed bottom navigation bar now appears on small screens, providing direct access to the main sections – My Plants, Dashboard, and Call Log. A "More" button opens a bottom sheet drawer with everything else: your profile, account settings, user administration, support, feedback, and the Kiona product switcher.
Additional improvements to the drawer:
- Swipe-down-to-dismiss functionality
- Drill-in sub-pages with a back button
Date pickers
The single-date and date-range pickers now use the same mobile bottom-sheet pattern (with swipe-to-dismiss) as the rest of the app, rather than a custom drawer implementation.
Shared drawer behaviour
Touch drag-to-dismiss, backdrop dimming, and the grab-handle layout are now a single shared module used across all mobile bottom sheets — popovers, select menus, and date pickers.
Operation Center updates – Desktop only
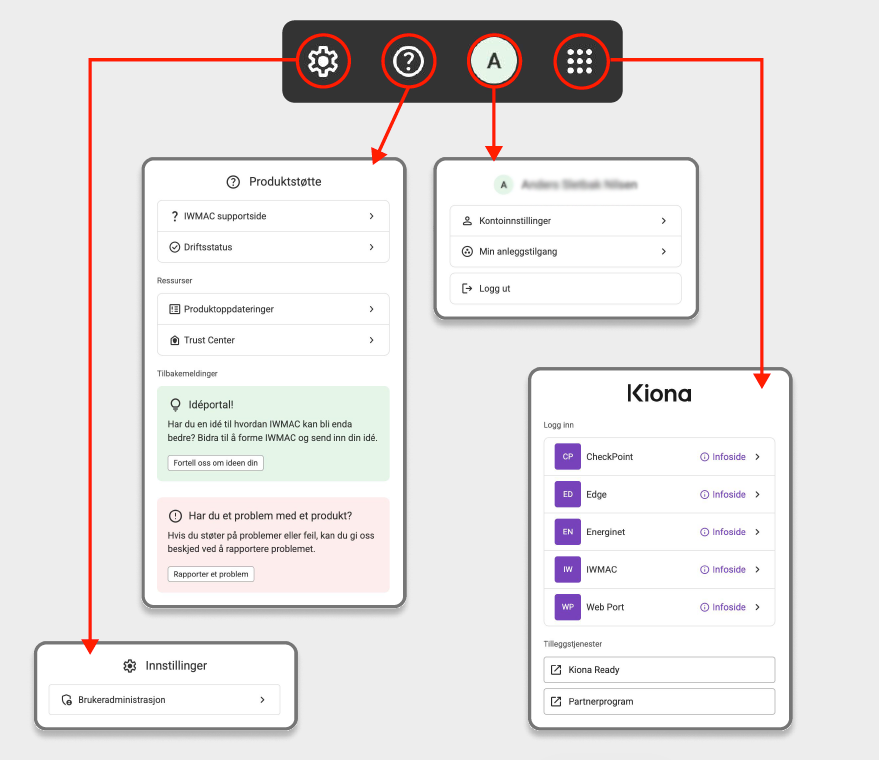
Popover menus
The old full-width slide-in panels for Settings, Help, Account, and Products have been replaced with individual popover panels that appear directly below their trigger buttons in the top bar. Only one can be open at a time – opening one closes the others. This feels snappier and keeps you oriented on the page.
Operation Center updates – both Mobile and Desktop
Instant language switching
Previously, changing your language in Account Settings required a page refresh to take effect across the app. Now the UI updates immediately after saving. Language changes now take effect immediately without requiring a page refresh
- "Changes saved" notifications appear in the selected language
- Language selection has been removed from the top bar
- Language is now managed exclusively via Account Settings
Page titles in the top bar
- Each main page now includes a clear, semantic title (e.g., My Plants, Dashboard)
- Displayed in the top bar for better orientation
- Especially helpful on mobile, where the sidebar is hidden
- Supports improved accessibility and WCAG compliance
Translations
Updated Dashboard translations for Norwegian, Swedish, Finnish, Danish, and German to use more natural and common terms.
Alarms
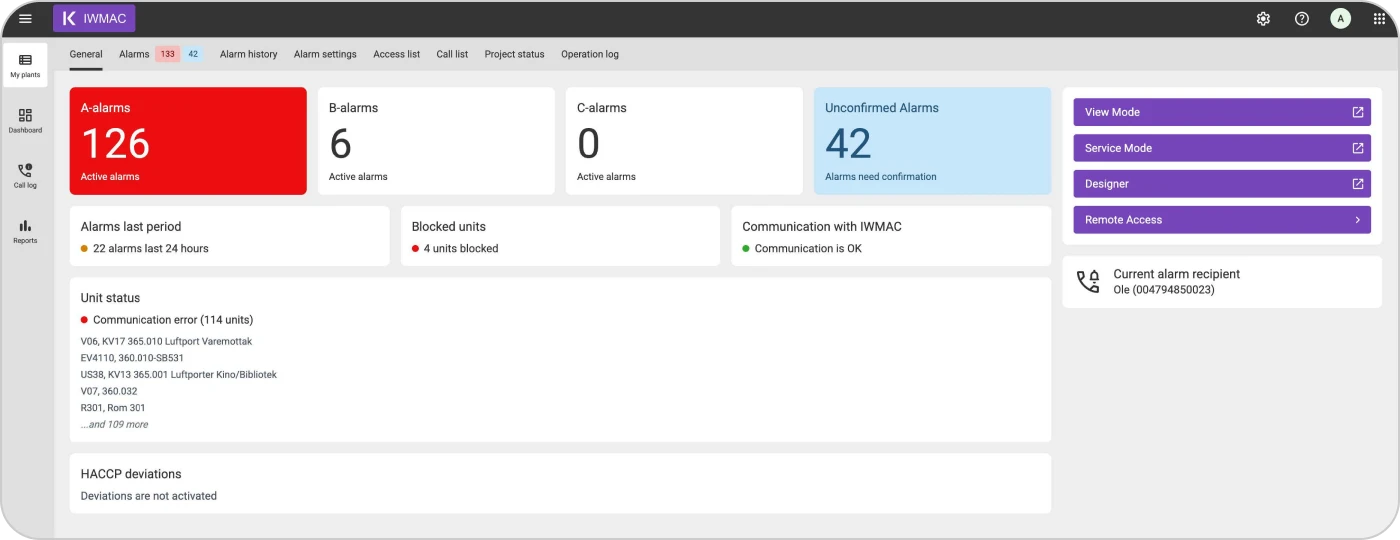
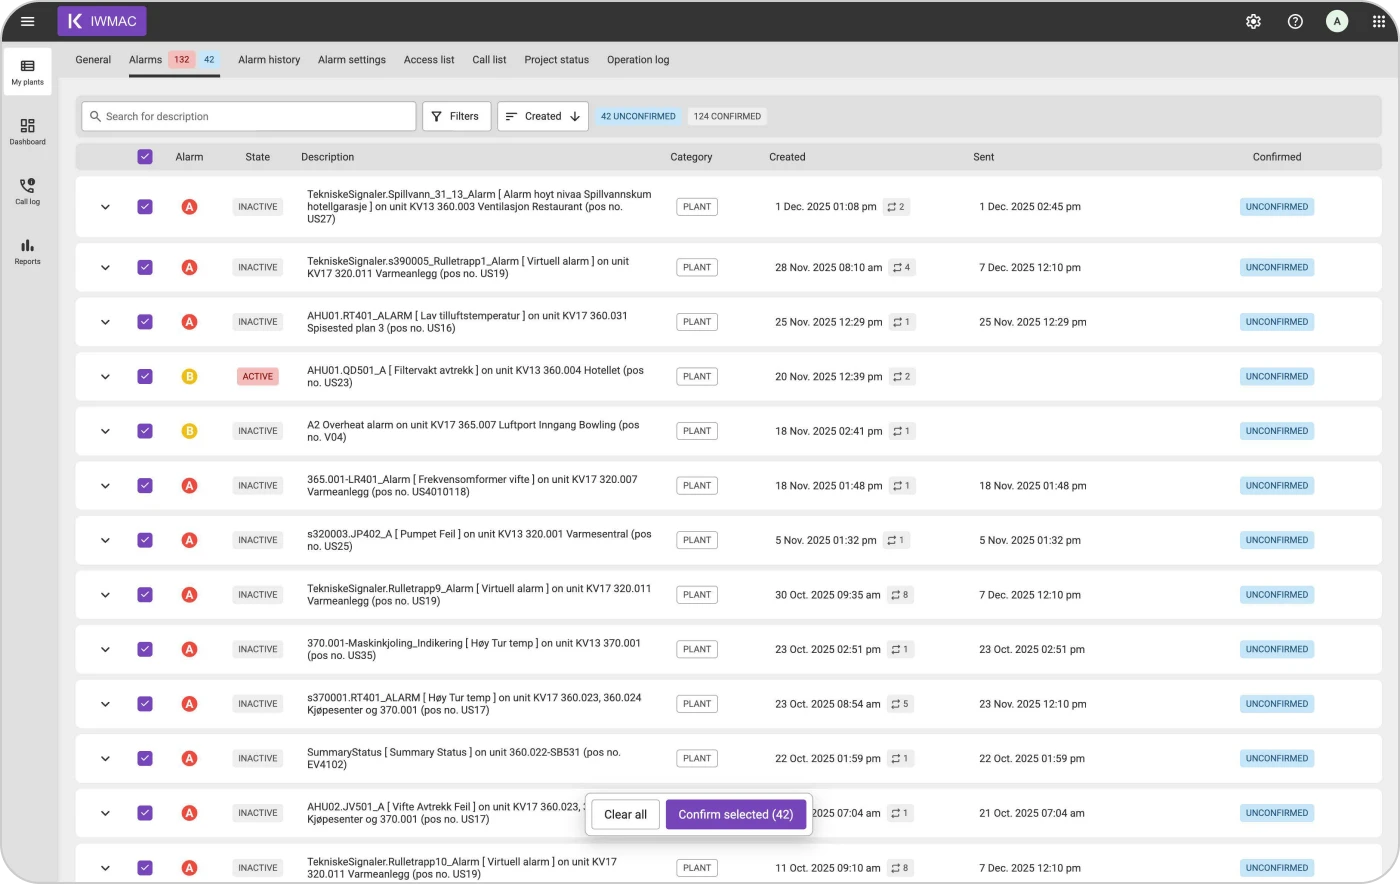
We've simplified how alarms are displayed so critical issues stand out immediately and are easier to address.
- The Alarms page now shows only active and unconfirmed alarms.
- Confirmed and closed alarms are transferred to Alarm History.
- Also, a new info card has been added to the "General" page, displaying the total number of unconfirmed alarms on a plant.
This provides a clearer overview and helps ensure that urgent alarms are addressed more swiftly.
Alarm history
The Alarm History page still offers a comprehensive overview, now with increased flexibility.
- Switch between alarm instances and alarm objects
- Alarm objects group confirmed and closed alarms
- Open an alarm object to view its full log for complete traceability
- Fully responsive and mobile-optimised across all devices
Plant view
We've improved My Plants to give users a clearer overview. You will now have clear visibility into the sites protected by Alarm Monitoring 24/7. You can also customise your plant list, show or hide columns, and pin your favourite plants to the top.
More improvements are:
- Added A-, B-, and C-alarm columns to the plant list (with the A-alarm column enabled by default) with sorting and column visibility.
- Adjusted column order
- Expanded card layout
- Possibility to hide zero counts in A/B/C cells
- Clearer header for Alarm Monitoring 24/7 and sort behaviour
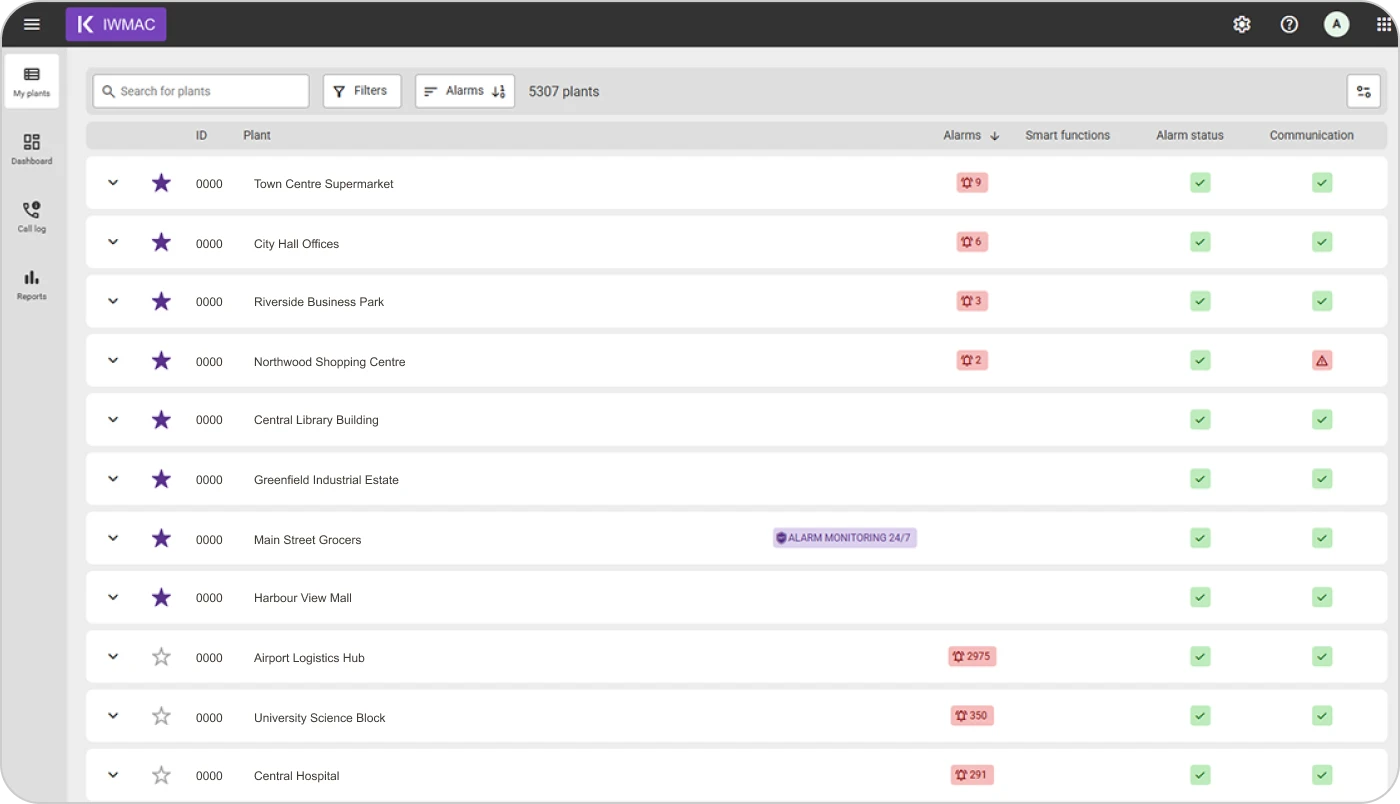
Expand a plant row to instantly see:
- Current alarm recipient
- Fice most recent alarms
- Active dispatch settings
- Any blocked units
Additionally, the "View mode" and "Service mode" buttons have been moved inside the expanded area, along with quick links to "Remote access" and "Designer" if the user has access to them.
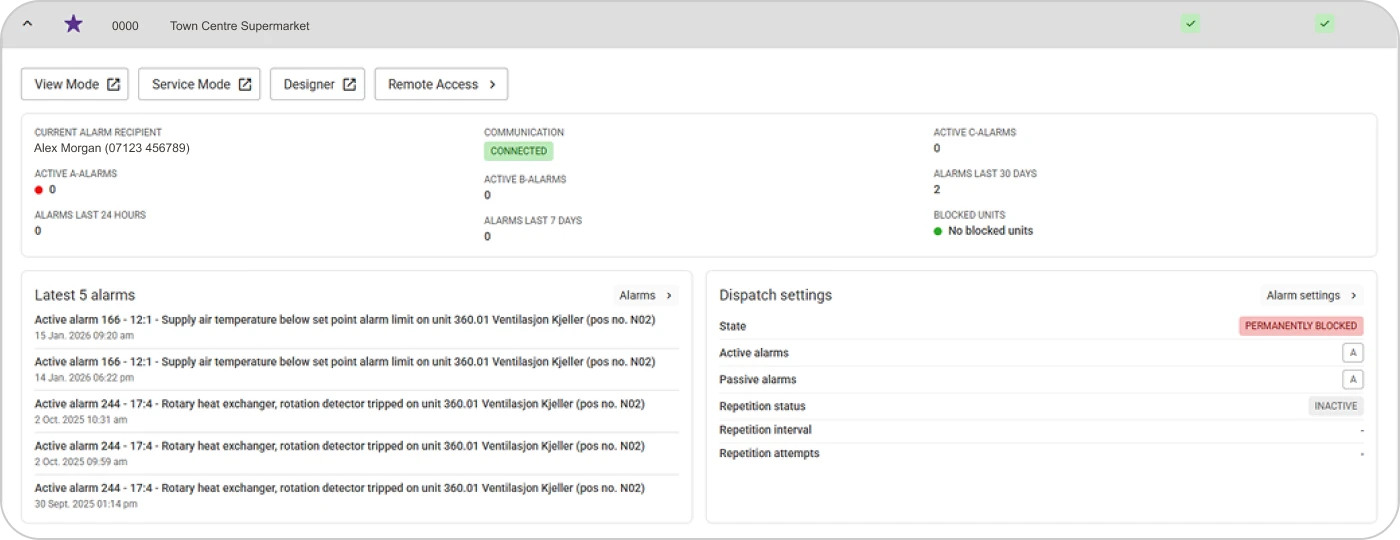
Finally, we have made a few fixes:
- Sorting in tables by clicking the table header is now available again.
- We have updated the terminology under "Communications." Previously, it was labelled as "Plant disconnected," but it will now be displayed as "Communication lost." This change aims to make it clearer that the disconnection is unintentional rather than deliberate.
Read more about updates to our platform.