

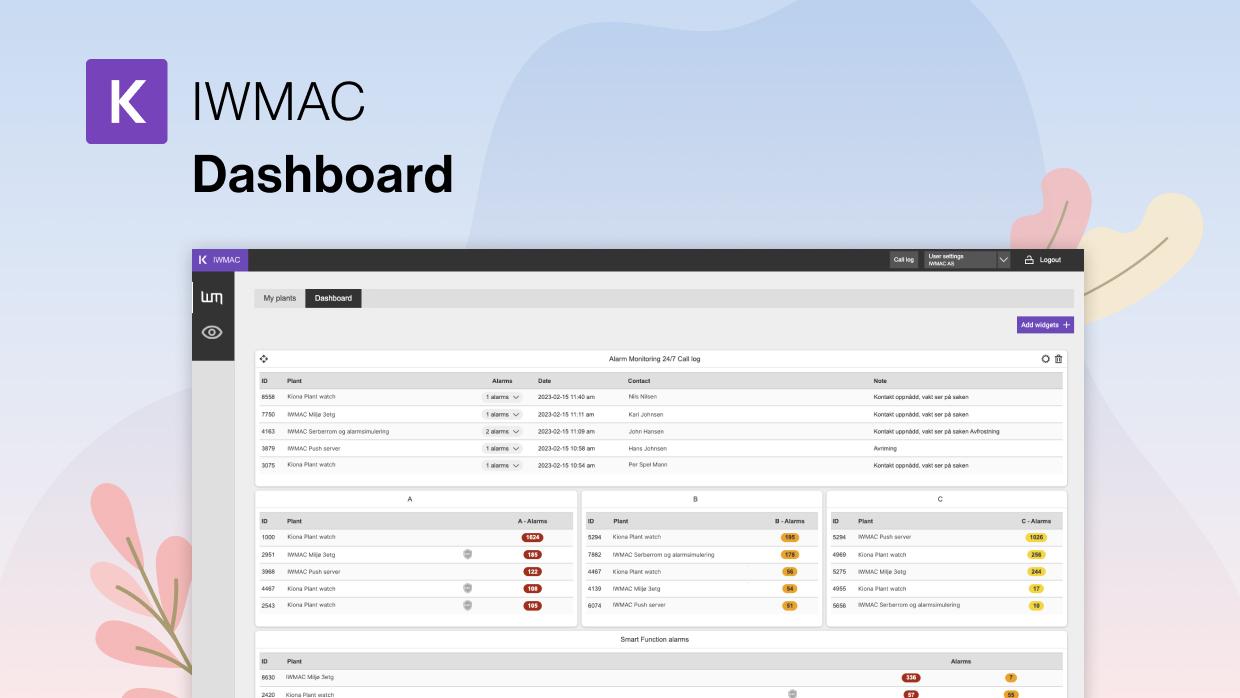
Product: IWMAC
New: Dashboard
Use the dashboard in IWMAC to compare multiple plants and to easier follow up on the plants with the most alarms. This means you quickly get an overview of deviations and can put measures at the plants that need it most.
In this first version, v.1 of the dashboard, you will have access to the following widgets:
- Alarm Monitoring 24/7 – Call log
- Alarms (choose between A,B or C alarms)
- Smart Function alarms
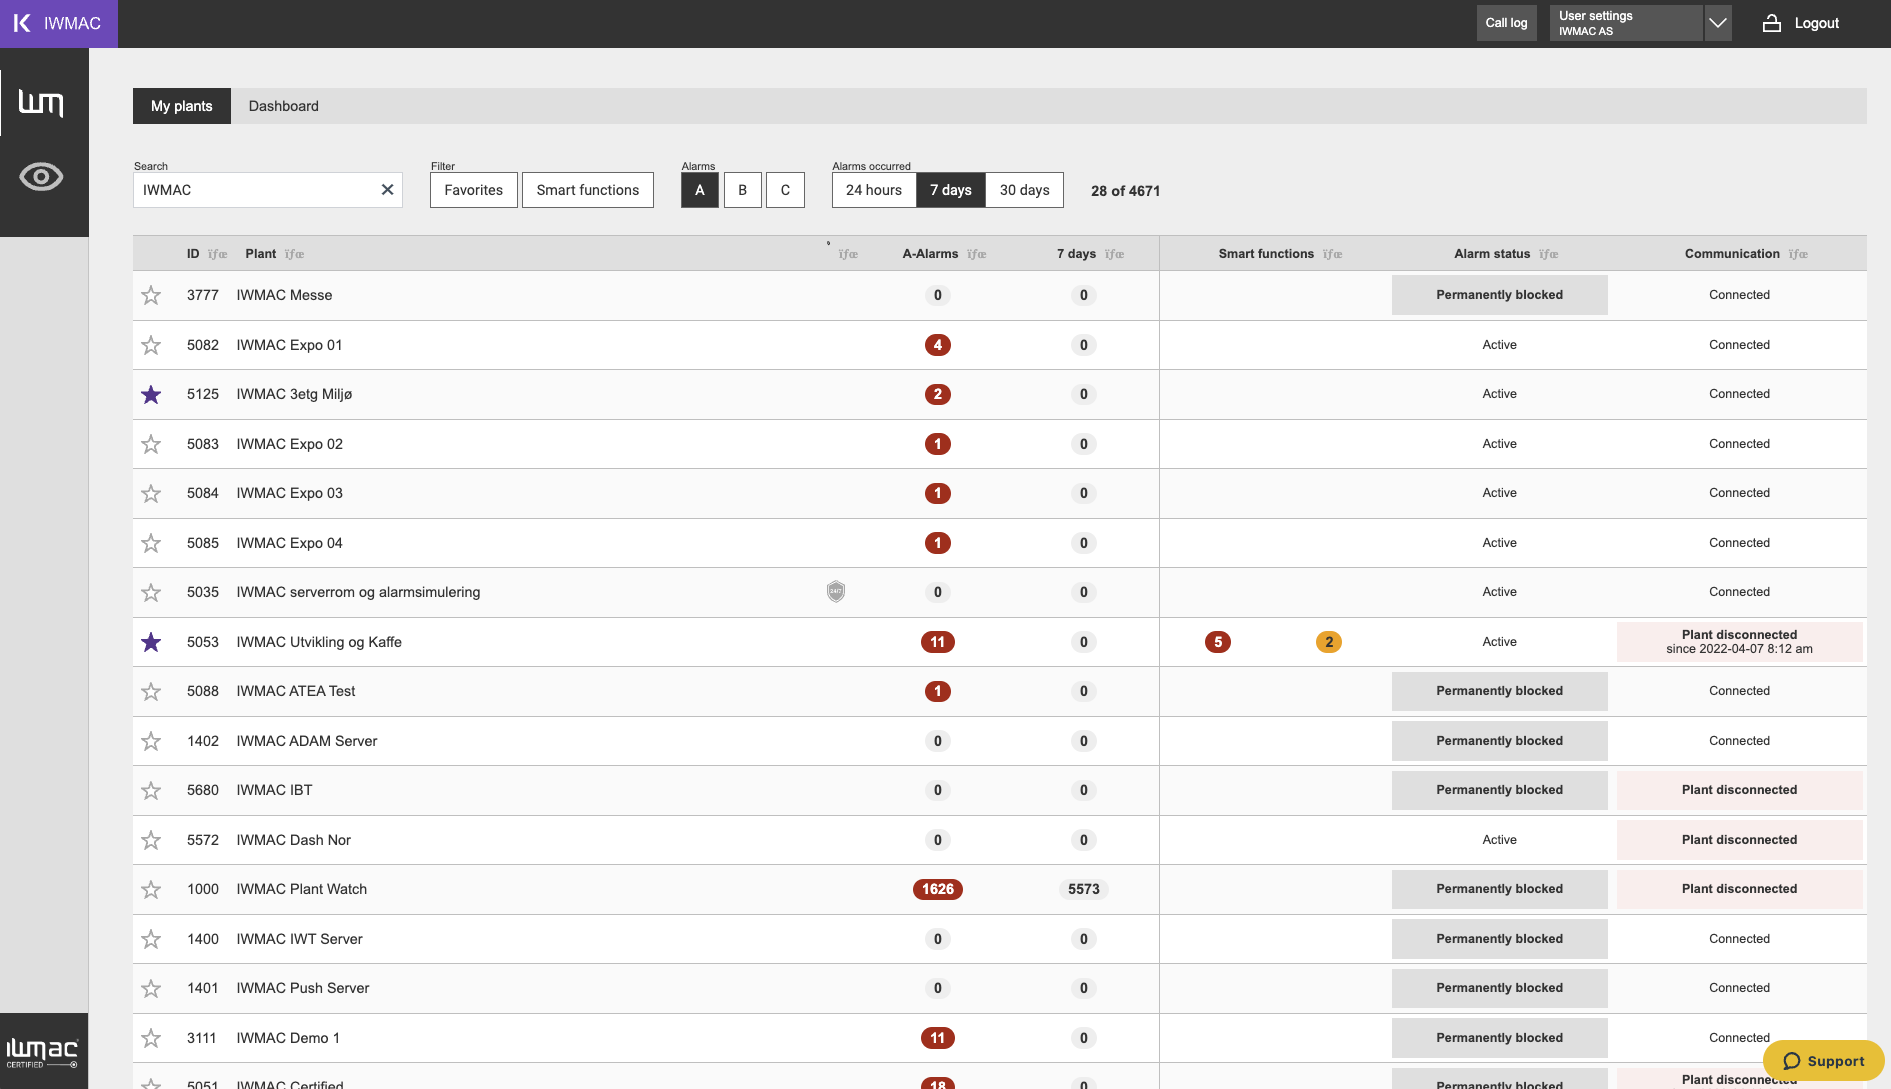
Start using the new dashboard
When you log in to IWMAC, you will find a new submenu. You can access your plant list from the "My plants" option and see the new "Dashboard" button.
When you open the dashboard for the first time, it will be empty. Start by adding widgets. You can change the title and how many rows you want shown in each widget.
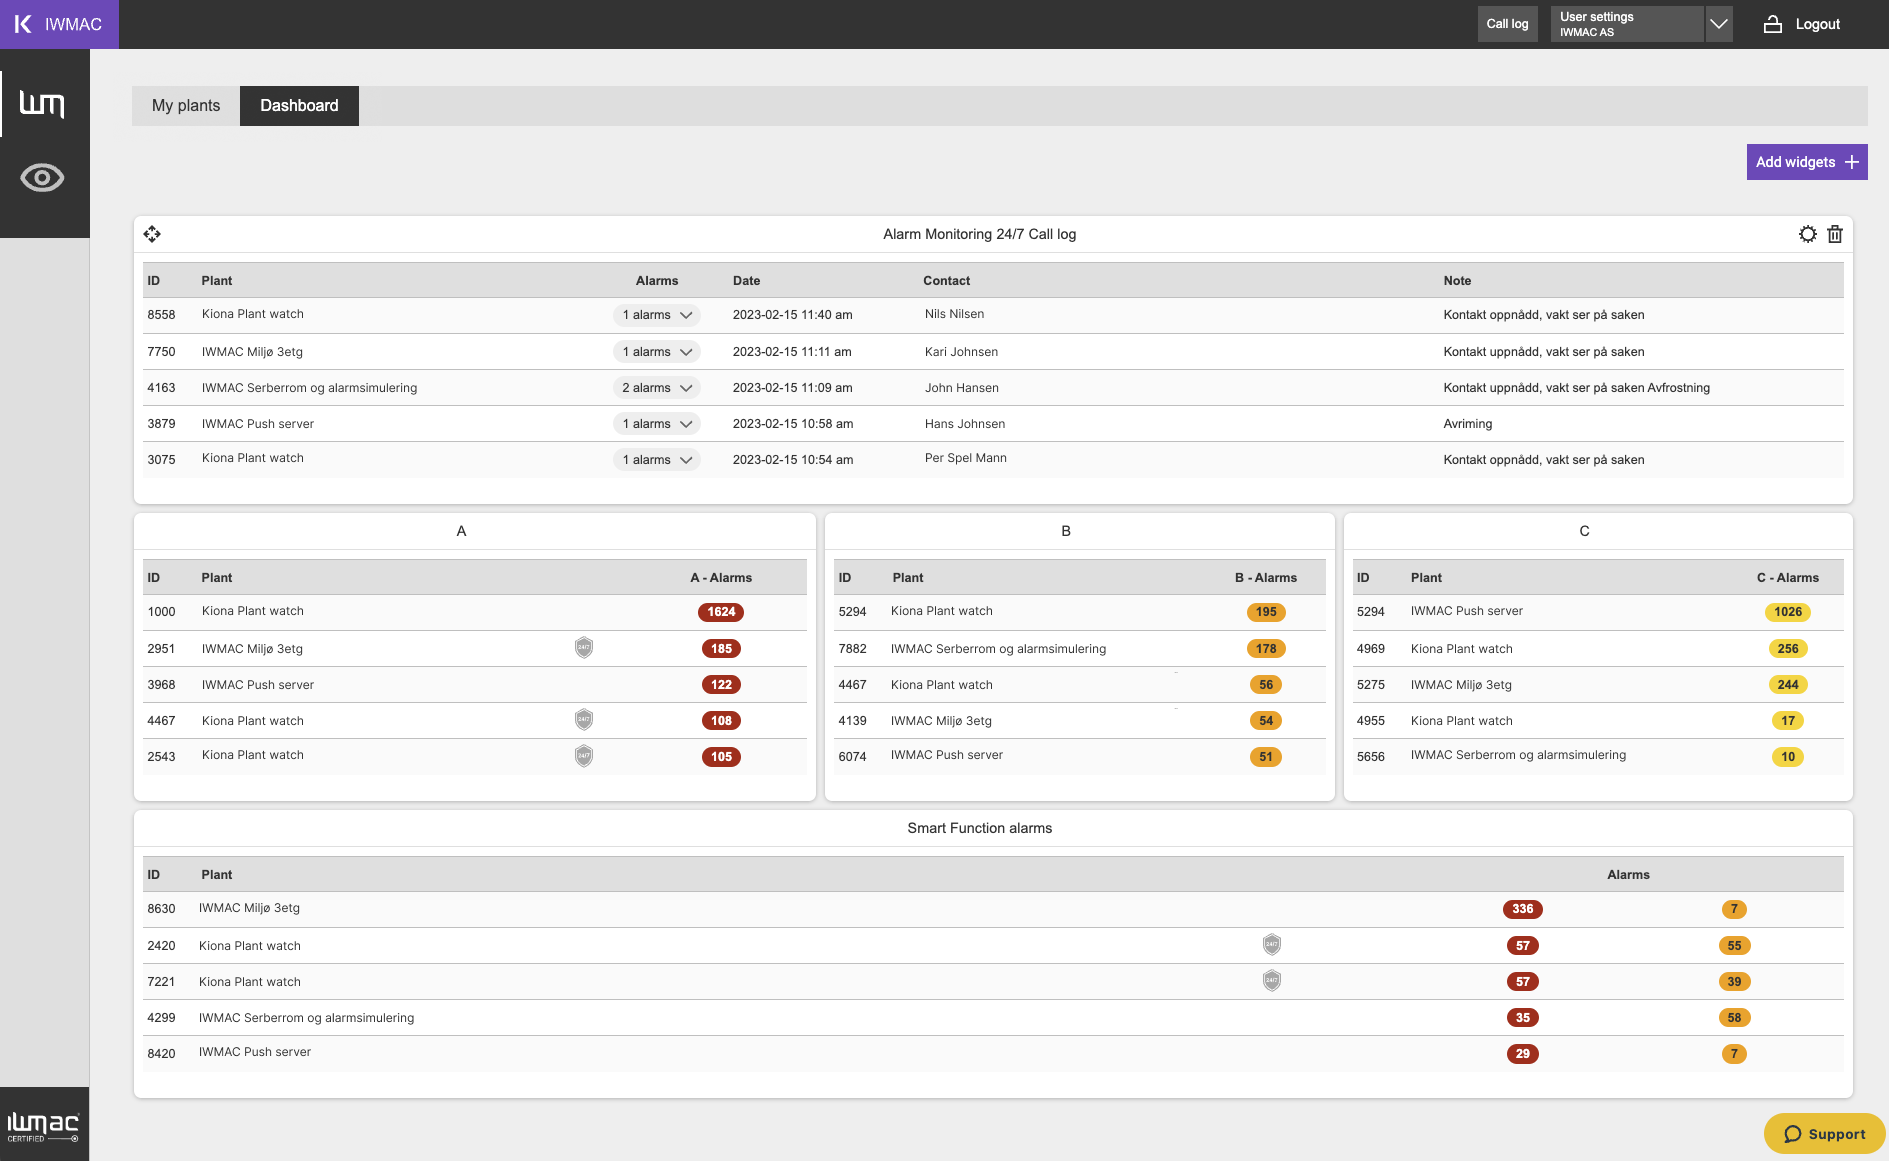
Each widget added to the dashboard comes with its own settings. They can easily be resized, moved around, edited, or deleted.
See help article to get started. Go to Zendesk.
Want to stay updated on the development of the dashboard, and other IWMAC releases?